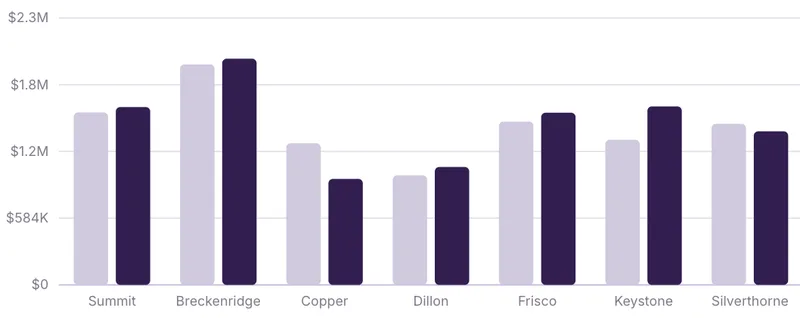

Summit County Real Estate Market Update – October 2026
October cooled the market a notch. The rolling 12-month median sales price slipped to $1,164,000, just off the $1,185,000 record set in August, but still 5.3% above last October. Closings dipped to 133, inventory is shrinking with the season, and buyers still hold the stronger hand at the negotiating table.
If September was the car easing into the slow lane, October is the stretch where everyone pulls off to put on snow tires before ski season. Here’s what the Summit County residential numbers show, with deed-restricted sales left out.
Prices: the median takes a breather
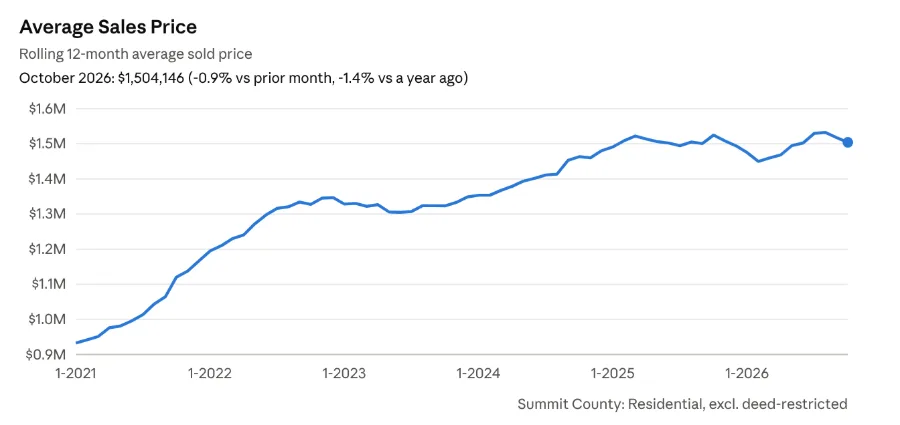
The rolling 12-month median dipped 0.9% from September ($1,175,000) and sits 1.8% below August’s record, but it’s still 5.3% above October 2025 ($1,105,500). The rolling 12-month average eased 0.9% from September to $1.504M, which is now 1.4% below last October ($1.525M).
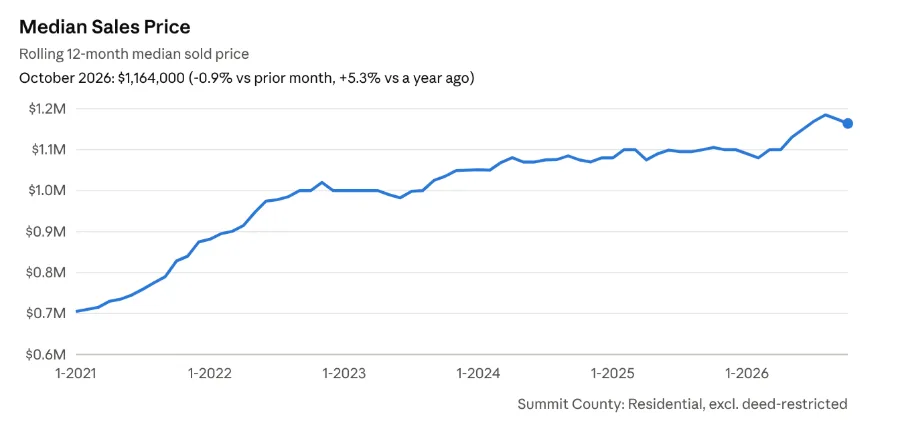
October on its own was softer. The month’s median sale was $1,090,000, down from $1,200,000 in September and $1,175,000 last October. Median price per square foot came in at $712, compared with $733 in September and $754 a year ago.
Part of that is the mix of what closed. Fourteen sales were under $500,000 (12 last October), while sales between $2M and $3M fell by half, from 24 to 12. One month swings with the mix, so the rolling 12-month figure is the steadier read.
By property type: new condos are lifting the condo average
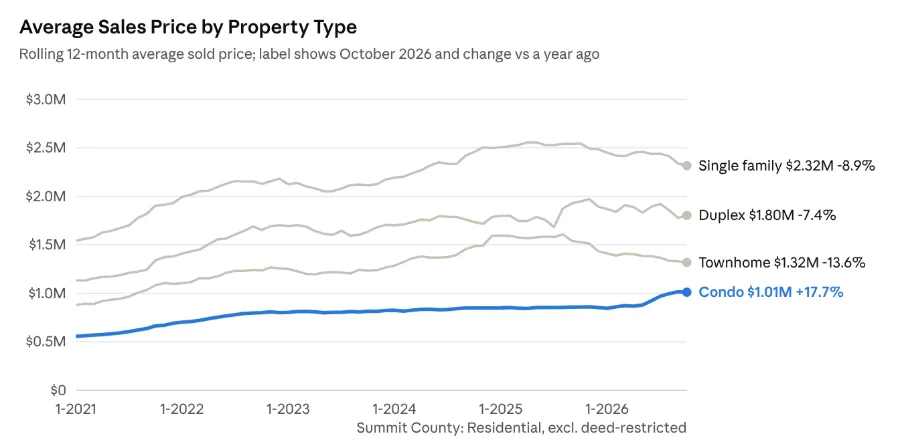
Condos show the biggest gain on paper, but new construction is doing the lifting. Condo sales in buildings from 2021 or newer nearly doubled over the past 12 months (153 vs 82) because of the Kindred project closing. Strip those out and the average resale condo is down 1%, at $818,068 vs $826,961 a year ago. Anecdotally in our business, we are seeing single family homes trend better in negotiations than attached properties.
Every other property type is averaging less than a year ago. Single-family homes are down 9%, duplexes 7% and townhomes 14%. Duplexes have only about 80 sales a year, so a few large closings move that line. Months of supply by type: duplexes 5.0, single family 5.9, townhomes 6.2 and condos 7.4.
Inventory: the fall pullback arrives
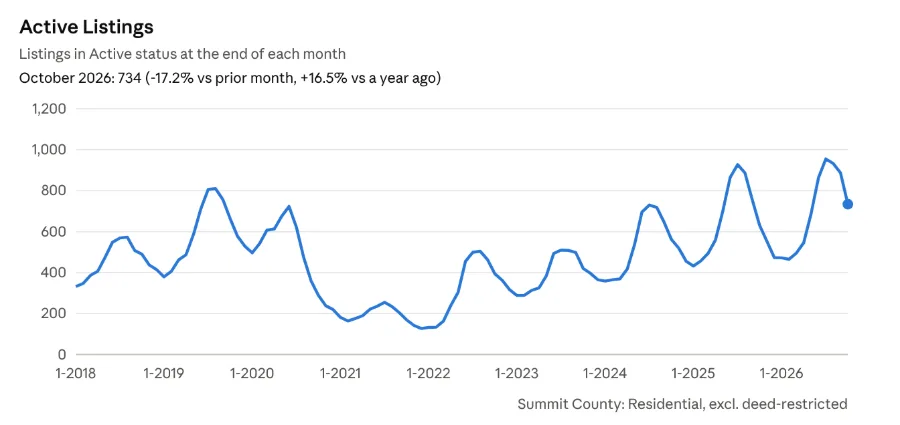
Active listings fell to 734 at the end of October, down from 887 at the end of September. That’s the normal fall pullback, and it’s still about 17% more than last October (630) and the most for any October in the data, which goes back to 2018. More than half of today’s listings (56%) have already had at least one price cut.
188 listings came off the market without selling in October (132 expired, 56 withdrawn). That’s the usual seasonal shift as owners switch to renting for ski season. More left the market than went pending, which is a sign of seller sentiment.
Activity: a quieter October than last year
- Sold listings: -14.2%
- Pending sales: -23.8%
- Sold, year to date: -3.2%
- Pending, year to date: -9.2%
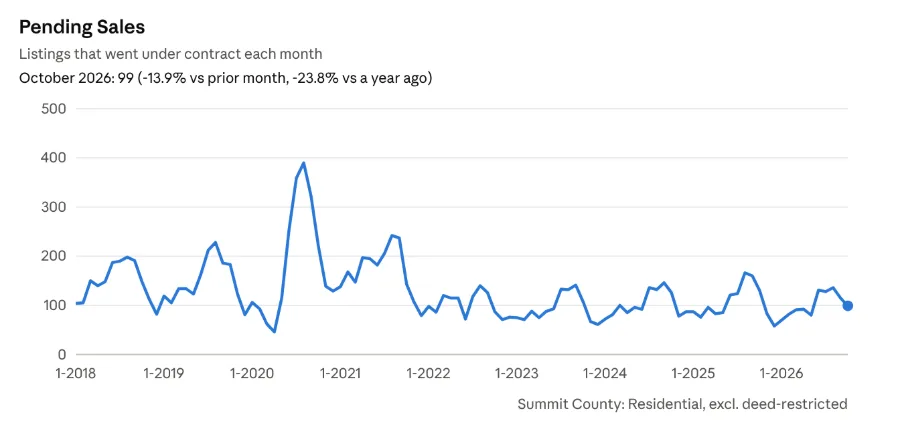
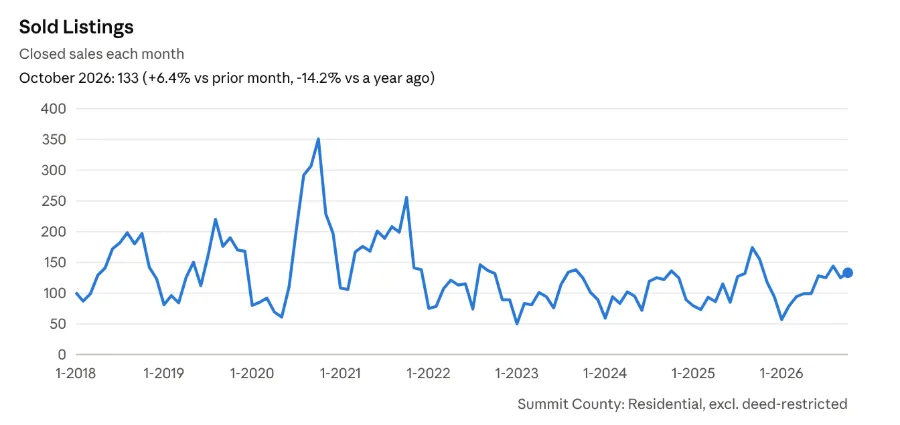
October 2025 was a strong month, so this year’s 133 closings look soft next to it. They’re right in line with 2022 through 2024 (132, 124 and 136), though. New contracts slowed more than closings did, which points to a quieter November and December for closings. New listings also fell, to 99 from 153 in September.
These October counts are preliminary. Late-reported deals usually add a few in the weeks after month-end.
Days on market and months of supply
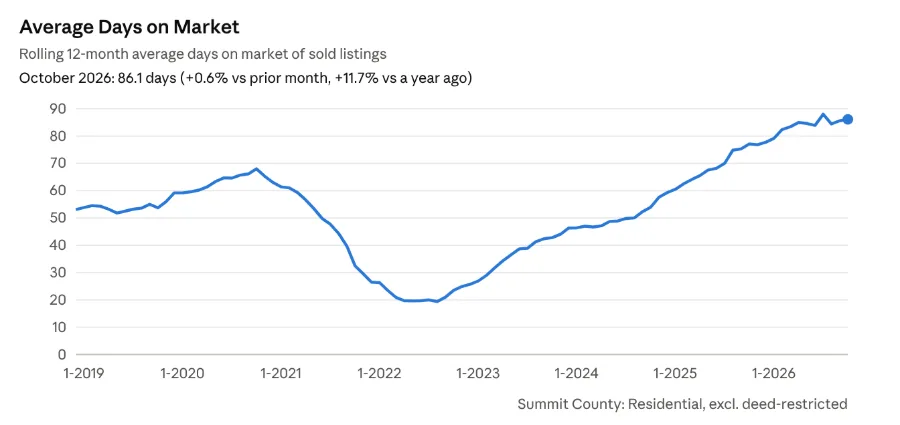
The rolling 12-month average days on market came in at 86 days. That’s up slightly from September (85.6) and from 77 a year ago, and more than four times the 19-day low of 2022.
Homes that sold in October spent a median of 61 days on market, a little faster than last October (65). Sellers got a median 97.3% of their final asking price but only 92.9% of their original price. That gap is the price cuts it took to get there, and it’s about where it was a year ago (97.2% and 92.9%).
By our math, 734 active listings against an average of about 108 closings a month (the last 12 months) works out to roughly 6.8 months of supply. That’s down from about 8.1 months in September, but up from about 5.7 months a year ago.
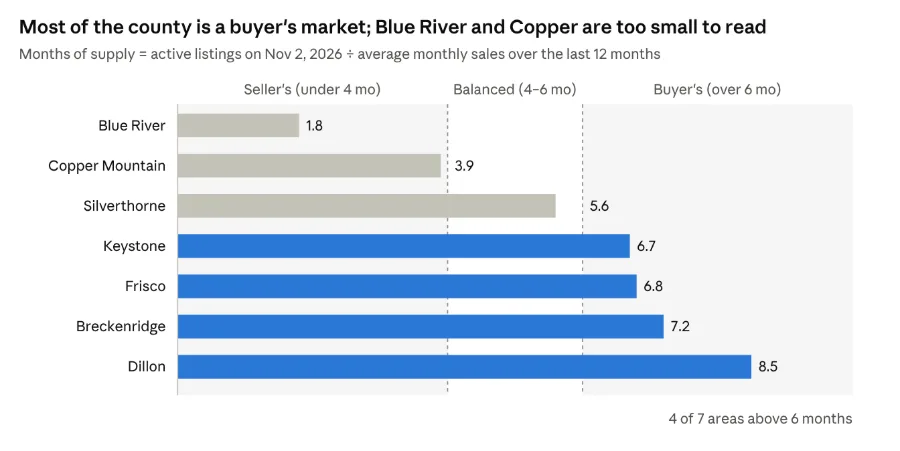
Where you are in the county matters a lot. Blue River and Copper Mountain show low supply, but they’re small markets (4 and 15 active listings), so a handful of sales swings their numbers either way. Dillon, with 8.5 months of supply (mostly condos), gives buyers the most room.
What it means heading into ski season
For buyers, late fall is a good window. There’s more to choose from than a year ago, more than half of sellers have already cut their price, and if they’re still on market they really want to sell.
For sellers, prices are holding, but buyers are patient and the first price matters more than ever. Of October’s 133 sales, the 57 that never cut their price sold in a median of 20 days at about 98% of asking. The 76 that needed a price cut took a median of 89 days and closed about 11% below their original asking price.
Source: our Summit County MLS residential data (single family, condo, townhome, duplex and mobile home), sales through November 2, 2026, with deed-restricted sales and listings left out.